
ATCOR4 - Sample Processing Results
Basics | Features | Database | Methods | Results
Images of AVIRIS, DAIS 7915, HyMap, Daedalus AADS1268, CASI, AISA, HySpex, and more have been successfully processed so far with ATCOR-4. This section presents some results for flat and rugged terrain.
1. HyMap Imagery, Flat Terrain
 Processing results for flat areas
 Processing results for flat areas
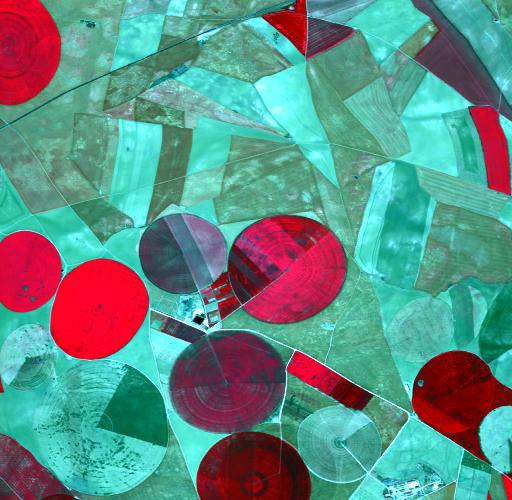
Fig. 1.1: HyMap scene of Barrax, color coding: RBG= 868, 656, 563 nm (bands 30, 16, 10)
The next scene presents HyMap imagery acquired at Barrax (Spain). The scene was recorded on 3rd June 1999 at 11:54 h UTC, as part of ESA's DAISEX'99 campaign. HyMap records 128 co-registered channels in the 0.4 - 2.5 um region. The flight altitude was 4 km above sea level and the ground elevation is 0.7 km asl. Flight heading was 180° (south), the solar zenith and azimuth angles were 17° and 170°, respectively. As the area of Barrax is flat no digital elevation model was employed for the atmospheric correction.
Fig 1.2 shows two surface reflectance spectra retrieved
from the scene. The solid curves indicate reflectance spectra retrieved from HyMap whilst
the dashed curves indicate ground reflectance measurements performed with
a FieldSpec FR spectroradiometer, averaged over about 20-40 samples per
field. The light-shaded areas indicate the +/- one standard deviation of
the ground truth measurements. The vertical dark-shaded areas mark regions
of strong atmospheric water vapor and CO2 absorption.
The deviation of ground measured and retrieved reflectance is in the
range 2-3% or better. In the 1.8-1.95 um region the HyMap instrument has
no spectral bands, so a straight line connects the wavelength gap between
spectrometer 3 and 4.
Fig 1.2: Comparison of retrieved HyMap spectra with ground measurements
The next two images correspond to Fig. 1.1. They show examples of value adding channels that can be calculated with the ATCOR model: the FPAR image (fraction of photosynthetically absorbed radiation, derived from a vegetation index) and the absorbed solar radiation. FPAR values range between 0 and 0.8 in this scene with values of 0.6 to 0.8 for the bright vegetated surfaces. The corresponding absorbed solar radiation image (unit: Watts per square meter) ranges between 650 and 850 W m-2. The absorbed radiaton is high for surfaces with low albedo and lower for the high albedo areas. The calculation of net radiation requires a sensor with reflective and thermal bands, see the section on DAIS-7915 imagery.
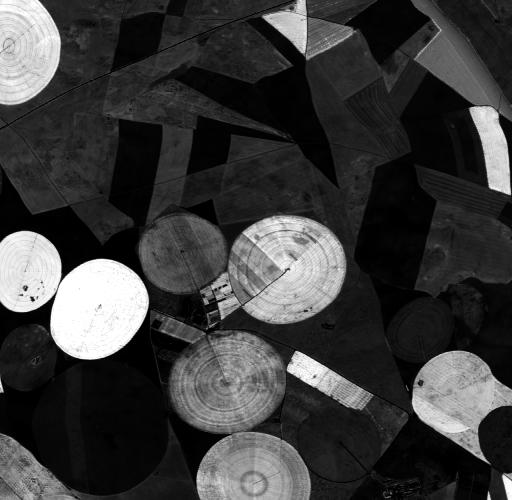
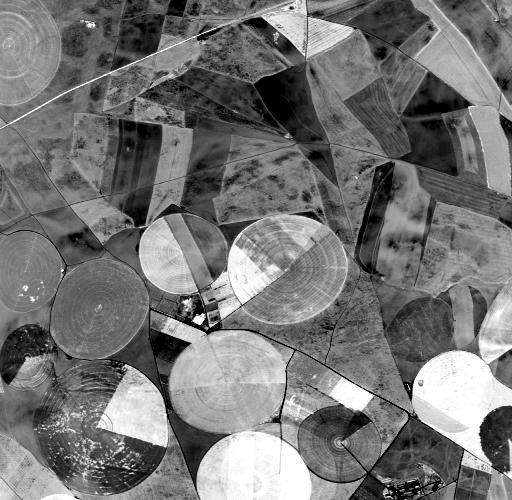
Fig. 1.3/1.4: Value adding channel: HyMap FPAR image and image of absorbed solar radiation
The next example demonstrates a sub-image of HyMap band 30 (868 nm) data acquired about 20 minutes after the imagery of Figure 1.1, with the scan direction in the solar principal plane (hot spot direction). The bright stripe in the vertical direction (top of figure) shows the strong bidirectional reflectance behavior for the hot-spot geometry. The data represents the surface reflectance image after atmospheric correction (but without geocoding). The bottom part shows a nadir reflectance image, where the bidirectional effects have been removed with an algorithm normalising the reflectance values to the nadir geometry.
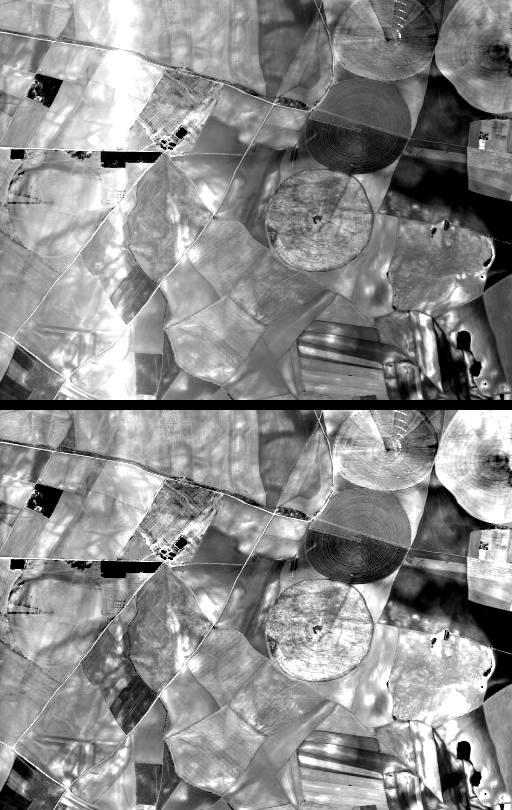 Fig. 1.5: Removal of bidirectional effects: nadir normalization of reflectance image
2. DAIS-7915 Imagery, Rugged Terrain
 Atmospheric and topographic correction
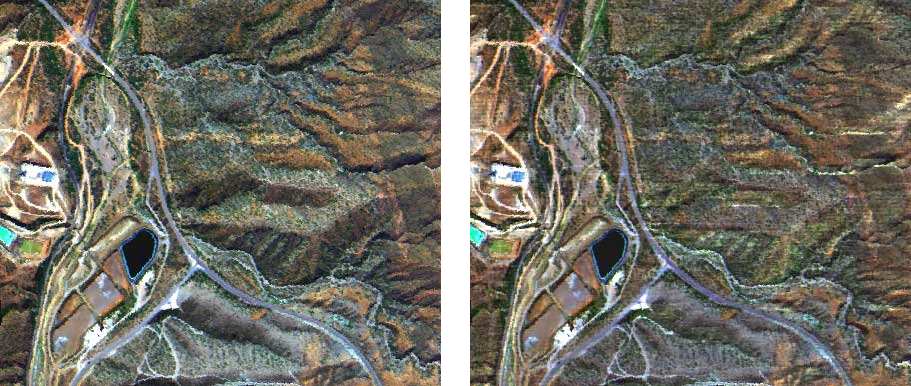
The following image shows a sub-image of a DAIS-7915 scene of Timna, Israel, acquired on 31st July 1997 at 9:37 h local time. The instrument records 79 co-registered spectral bands from 0.5 - 12 um (with gaps in the major atmospheric absorption regions). The flight altitude was 3650 m above sea level and flight heading was 156°. The solar zenith and azimuth angles were 31.7° and 104°, respectively. A digital elevation model of 25 m was resampled to 5 m to match the ground sampling distance of the sensor. The elevation range of the scene is 560 - 770 m with slopes up to 48°. The ortho-rectification was performed with the PARGE software. The processing was performed in the framework of a joint German-Israeli Foundation project.
Since the spatial resolution of the DEM is much coarser than the resolution of the airborne imagery, artifacts can be observed in the image. However, the topographically induced effects are clearly reduced in most parts of the image.
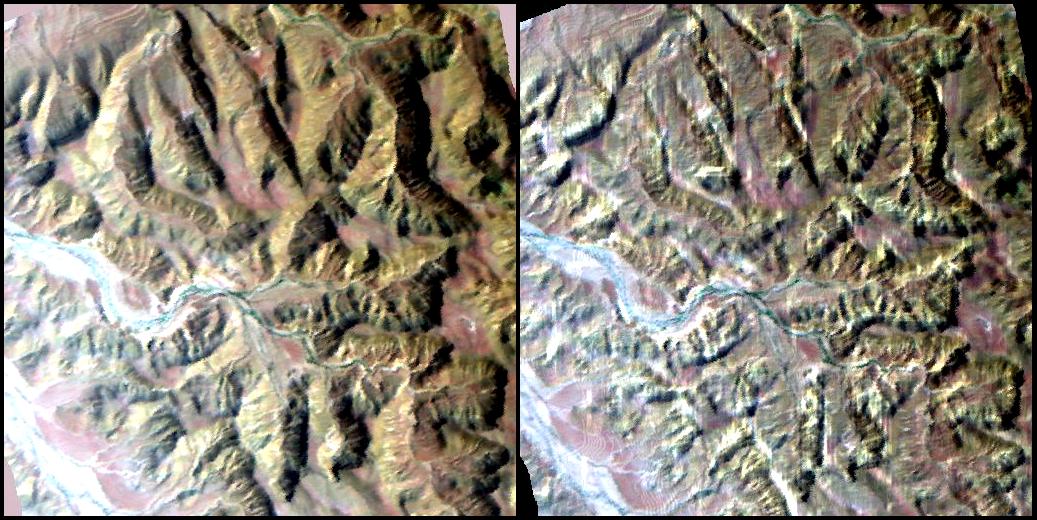
Fig. 2.1: DAIS sub-image of Timna, Israel, RGB=2.2, 0.86, 0.5 um. Left: original data after ortho-rectification, right: surface reflectance after atm./topograpic correction
The following spectra (Fig. 2.2) show the successful removal of topographic effects:
Without topographic correction a surface oriented to the sun appears
bright and is assigned a higher reflectance value than the same surface
would have if it were oriented away from the sun. With combined atmospheric
and topographic correction the reflectance values are calculated for a
flat horizontal surface. This means reflectance values for surfaces facing
the sun will be lowered, reflectance values for those oriented away from
the sun will be raised. Thus, the topographic influence is removed or at
least diminished.
Fig. 2.2: Illustration of the topographic effect on reflectance spectra (DAIS Timna scene).
Left: Pixel oriented toward the sun (slope 33 deg, aspect 143 degr.,
illumination angle 21 degr.)
Right: Pixel oriented away from the sun (slope 39 degr., aspect 214
degr., illumination angle 56 degr.)
Solid line: atmospheric and topographic correction,
Dashed line: only atmospheric correction.
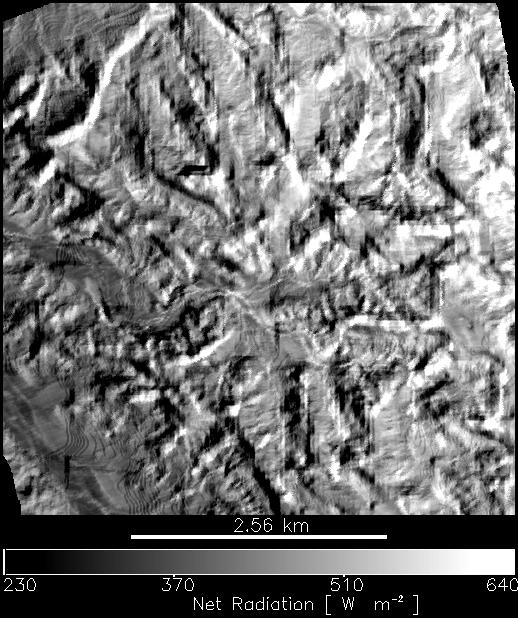
Fig. 2.3 shows an example of one of the value added products that can be calculated with the ATCOR4 model; the net radiation image corresponding to the DAIS Timna scene above. Net radiation is the sum of the absorbed solar radiation and the longwave thermal radiation (downwelling thermal atmospheric radiation minus emitted surface radiation). It can be calculated for sensors with co-registered bands in the reflective and thermal region if information on air temperature and humidity is supplied. Net radiation indicates the energy available for the surface to air exchange (sensible heat), heat flux into the ground, and latent heat of evaporation. It is of major interest for climatic investigations, agriculture, and forestry. Net radiation is calculated in units of Watts per square meter.
 (81k)
Fig. 2.3: Value adding channel: Net radiation (DAIS Timna scene).
(81k)
Fig. 2.3: Value adding channel: Net radiation (DAIS Timna scene).
3. AVIRIS Imagery, Rugged Terrain
 Terrain correction result
The next image shows a low altitude AVIRIS scene acquired on 3rd October 1998. It is located in the Ray Mine area (AZ). The flight altitude was 4 km above sea level, flight heading 190° ( nearly south), the solar zenith angle is 38.5°., and the azimuth angle is 162.8°. The image was first ortho-rectified (with PARGE) to a US-GS digital elevation model resampled from the original 30 m resolution to the 3.6 m AVIRIS resolution. The elevation of the scene ranges from 500 to 800 m. The RGB composite represents AVIRIS channels 35, 20, 10 at 682, 556, 457 nm, respectively. Details are discussed elsewhere (see Schläpfer et al. 2000, Reference Publications ).
Fig. 3.1: Left: Geocoded image, AVIRIS RGB, right: after atm/topographic correction
The radiometric processing removes the terrain shading effects significantly. Residual topographic features can still be observed, mainly because high frequency spatial variations are not included in the coarse DEM.
4. AVIRIS Imagery, Cirrus Removal
 Cirrus Removal Sample
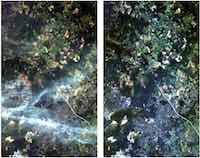
Cirrus detection and removal requires data recording above the cirrus clouds. Since cirrus occurs in high altitudes (8 - 16 km) such data is only available from space instruments or sensors on very high altitude aircrafts, e.g. AVIRIS on the ER2 flown at an altitude of 20 km. Fig. 4.1 shows an example of an AVIRIS scene with cirrus acquired on 7th July 1996 over Bowie, MD (courtesy of JPL). The left part presents a true color image of the original scene, the right part is the result after cirrus removal. Thin and thick cirrus clouds are successfully removed.
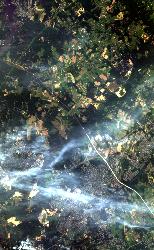
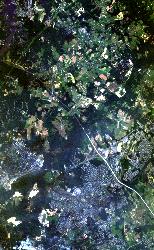
Fig. 4.1: Left: AVIRIS high altitude RGB, right: after haze and cirrrus removal
5. CASI Imagery, BREFCOR Correction
 BRDF Correction Sample
Wide FOV airborne data are strongly affected by BRDF effects. The BREFCOR method included in ATCOR
allows to use the Ross-Thick-Li-Sparse (RTLS) physical BRDF model to perform a surface-cover dependent
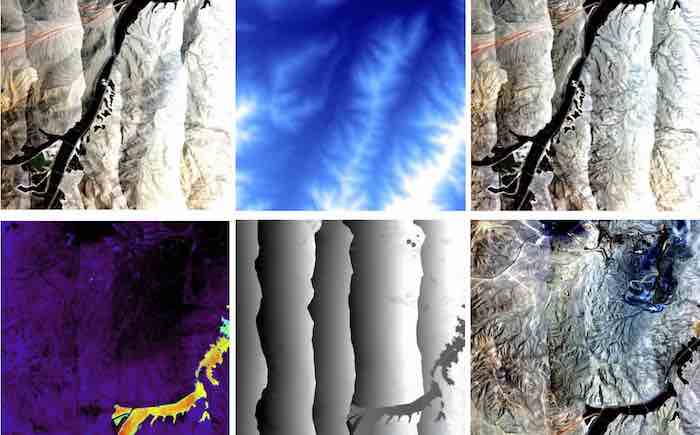
correction of BRDF effects. A sample of CASI 1500 data acquired in Chile is shown in Figure 5.1.
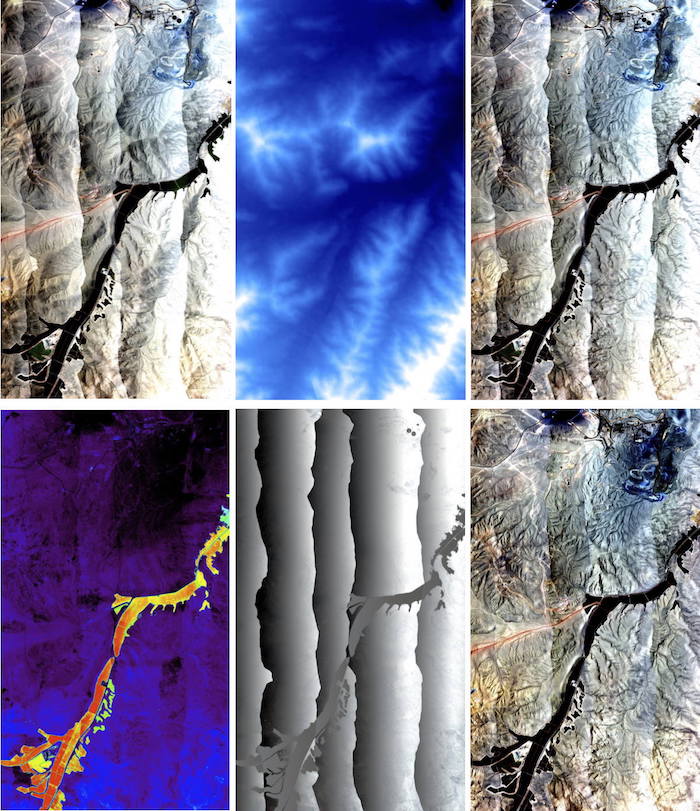
Fig 5.1: CASI BRDF correction process layers: upper left: at-sensor, middle: DEM, right: ATCOR correction
lower left: BRDF cover class (BCI), middle: BRDF Anisotropy, right: after BRDF correction.
The BREFCOR procedure steps are as follows:
- Calibrate BRDF model from image itself or similar imagery
- Calculate BRDF cover index map
- Combine RTLS model with observation angle geometry and cover index to find anisotropy (i.e., deviation from spectral albedo)
- Apply BRDF correction to all spectral bands of imagery.
The method is applicable to hyperspectral imagery but also to 4-band digital photogrammetric data such as ADS-80/ADS-100.
6. HYSPEX Imagery, SHAOT Correction
 Shadow based Aerosol optical thickness Retrieval and Correction
The correction of Aerosol effects depends on the accuracy of the Aeorosol optical thickness (AOT) retrieval from
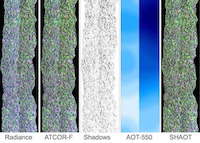
Airborne data. For high resolution imagery, the use of cast shadow areas is an option to derive
spatial distributions of aerosols and to use this map as input to ATCOR-4 atmospheric compensation.
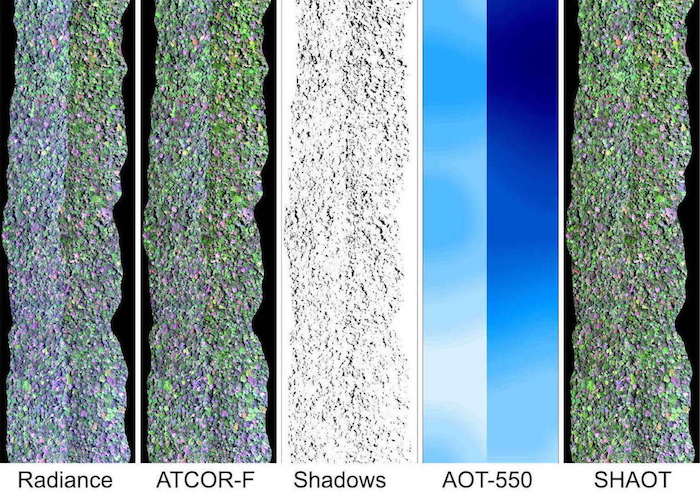
Fig 6.1: HYSPEX SHAOT correction results (French Guiana, mosaic). Left: at-sensor radiance, 2nd: ATCOR standard processing; 3rd: image based shadow detection; 4th: shadow based AOT distribution; right: after SHAOT correction.
The SHAOT procedure steps are as follows:
- Find cast shadow areas
- Optimize diffuse irradiance component over cast shadows
- Find spatial AOT distribution
- Apply ATCOR-4 with AOT distribution input.
The method has been successfully applied to APEX and HYSPEX hyperspectral imagery but also to 4-band digital photogrammetric data such as ADS-80/ADS-100.